

- Topic
9k Popularity
97k Popularity
126k Popularity
6k Popularity
2k Popularity
- Pin
- 🎉 Hey Gate Square friends! Non-stop perks and endless excitement—our hottest posting reward events are ongoing now! The more you post, the more you win. Don’t miss your exclusive goodies! 🚀
🆘 #Gate 2025 Semi-Year Community Gala# | Square Content Creator TOP 10
Only 1 day left! Your favorite creator is one vote away from TOP 10. Interact on Square to earn Votes—boost them and enter the prize draw. Prizes: iPhone 16 Pro Max, Golden Bull sculpture, Futures Vouchers!
Details 👉 https://www.gate.com/activities/community-vote
1️⃣ #Show My Alpha Points# | Share your Alpha points & gains
Post your - 🚀 ETH jumped to $4,600 this morning, up 8.69% in 24h!
Just shy of the $4,891 ATH—think it breaks through?
📍 Follow Gate_Square, vote and drop your reason.
🎁 4 winners split $100 Futures Voucher! - 📢 Exclusive on Gate Square — #PROVE Creative Contest# is Now Live!
CandyDrop × Succinct (PROVE) — Trade to share 200,000 PROVE 👉 https://www.gate.com/announcements/article/46469
Futures Lucky Draw Challenge: Guaranteed 1 PROVE Airdrop per User 👉 https://www.gate.com/announcements/article/46491
🎁 Endless creativity · Rewards keep coming — Post to share 300 PROVE!
📅 Event PeriodAugust 12, 2025, 04:00 – August 17, 2025, 16:00 UTC
📌 How to Participate
1.Publish original content on Gate Square related to PROVE or the above activities (minimum 100 words; any format: analysis, tutorial, creativ - 💙 Gate Square #Gate Blue Challenge# 💙
Show your limitless creativity with Gate Blue!
📅 Event Period
August 11 – 20, 2025
🎯 How to Participate
1. Post your original creation (image / video / hand-drawn art / digital work, etc.) on Gate Square, incorporating Gate’s brand blue or the Gate logo.
2. Include the hashtag #Gate Blue Challenge# in your post title or content.
3. Add a short blessing or message for Gate in your content (e.g., “Wishing Gate Exchange continued success — may the blue shine forever!”).
4. Submissions must be original and comply with community guidelines. Plagiarism or re - 🎉 The #CandyDrop Futures Challenge# is live — join now to share a 6 BTC prize pool!
📢 Post your futures trading experience on Gate Square with the event hashtag — $25 × 20 rewards are waiting!
🎁 $500 in futures trial vouchers up for grabs — 20 standout posts will win!
📅 Event Period: August 1, 2025, 15:00 – August 15, 2025, 19:00 (UTC+8)
👉 Event Link: https://www.gate.com/candy-drop/detail/BTC-98
Dare to trade. Dare to win.
Here’s Bitcoin’s timeframe to claiming $200,000 ATH
With Bitcoin (BTC) reclaiming the $120,000 support, the asset’s long-term price structure signals the potential for a breakout toward $200,000 in the coming months.
This possibility was shared by popular cryptocurrency analyst TradingShot, who noted that Bitcoin has extended its rebound from the 50-week moving average (MA), recently reinforced by a short-term bounce on the daily MA50.
TradingShotIn an August 12 TradingView post, the analyst noted that this renewed momentum shifts the technical focus back to the macro trend, where the next significant hurdle lies at the 0.5 Fibonacci retracement level, the midpoint of the ascending channel that has guided Bitcoin’s price action since late 2017.
TradingView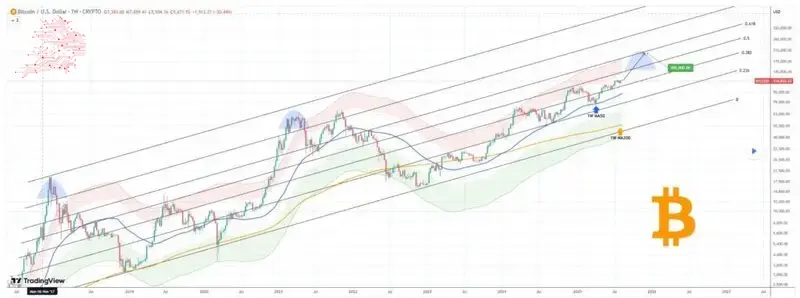 Bitcoin price analysis chart. Source: TradingView
![]() Bitcoin price analysis chart. Source: TradingView**Bitcoin price analysis chart. Source: TradingViewHistorically, this 0.5 Fib level has been a formidable resistance zone, last rejecting Bitcoin on December 16, 2024, and acting as a ceiling since May 2022
Bitcoin price analysis chart. Source: TradingView**Bitcoin price analysis chart. Source: TradingViewHistorically, this 0.5 Fib level has been a formidable resistance zone, last rejecting Bitcoin on December 16, 2024, and acting as a ceiling since May 2022
Despite this, previous cycle tops have not only broken above the 0.5 Fib but also reached levels above the 0.786 Fibonacci mark, nearing the channel’s upper boundary.
A break above the 0.5 Fib could send Bitcoin toward the 0.618 level, potentially testing $200,000 near the next cycle peak later this year. This would place it in the upper red zone of the Mayer Multiple Bands, still within historical norms, with late 2025 likely to be pivotal for price discovery.
Bitcoin key support zones to watch
Meanwhile, as Bitcoin eyes a new record high, trading expert Ali Martinez has pointed to Glassnode’s UTXO Realized Price Distribution (URPD) data showing two key support zones anchoring its price: $118,163 and $116,934, where large volumes of BTC last changed hands.
Bitcoin price analysis
By press time, Bitcoin was trading at $120, 920, up 2.3% in the last 24 hours and 6.6% on the weekly chart.
At the same time, Bitcoin’s 14-day Relative Strength Index (RSI) stands at 59.57, suggesting moderate upward momentum without immediate signs of overheating.
Featured image via Shutterstock
Featured image via ShutterstockFeatured image via Shutterstock