CRYPTOUSDUA
🚀 ETH has exceeded $460 billion in market cap!
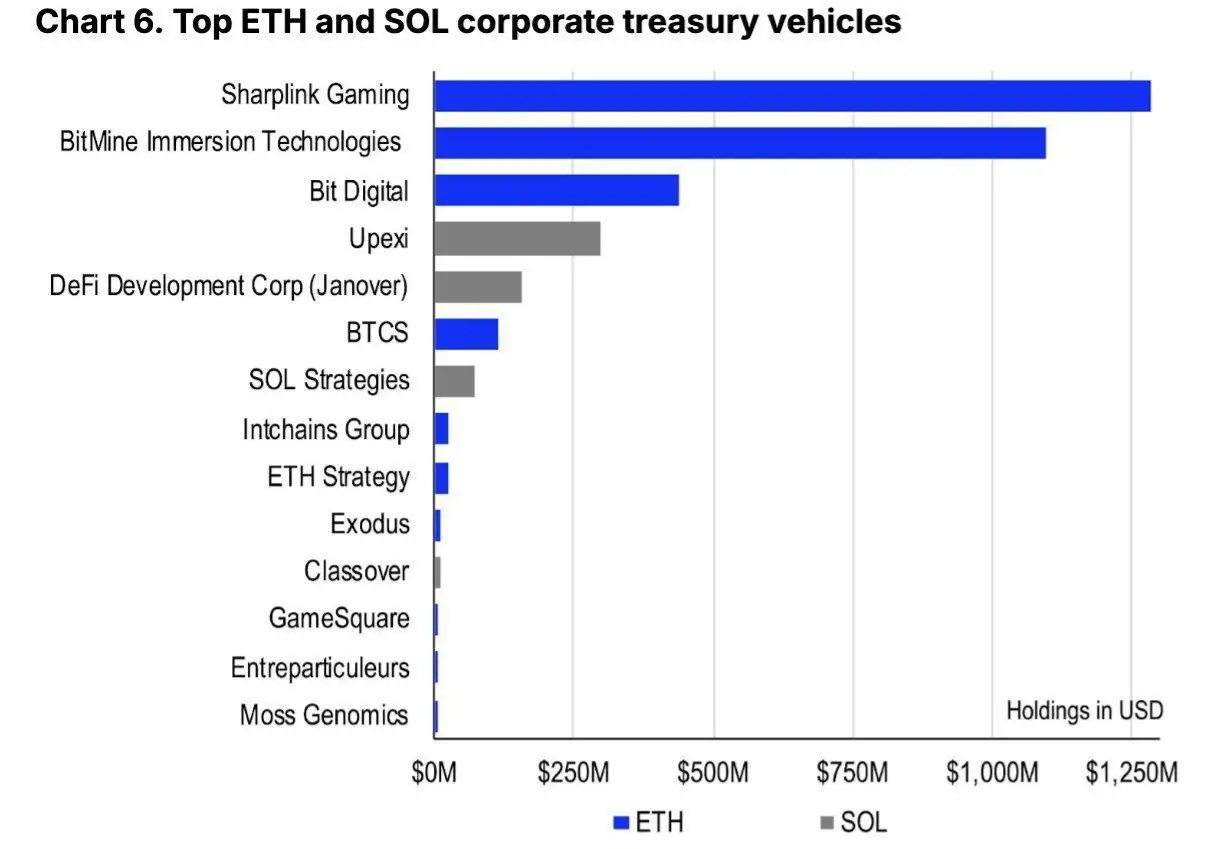
Ethereum is confidently strengthening its position in the market, having exceeded the market cap of $460,000,000,000. This highlights the high demand for ETH, the growing interest in DeFi, L2 and ETH ETF.
🟩 The network is active
📈 Institutions are entering
🔥 ETH is not just an alt, it is the digital infrastructure of the future.
#Ethereum # ETH #CryptoMarket # DeFi #Web3
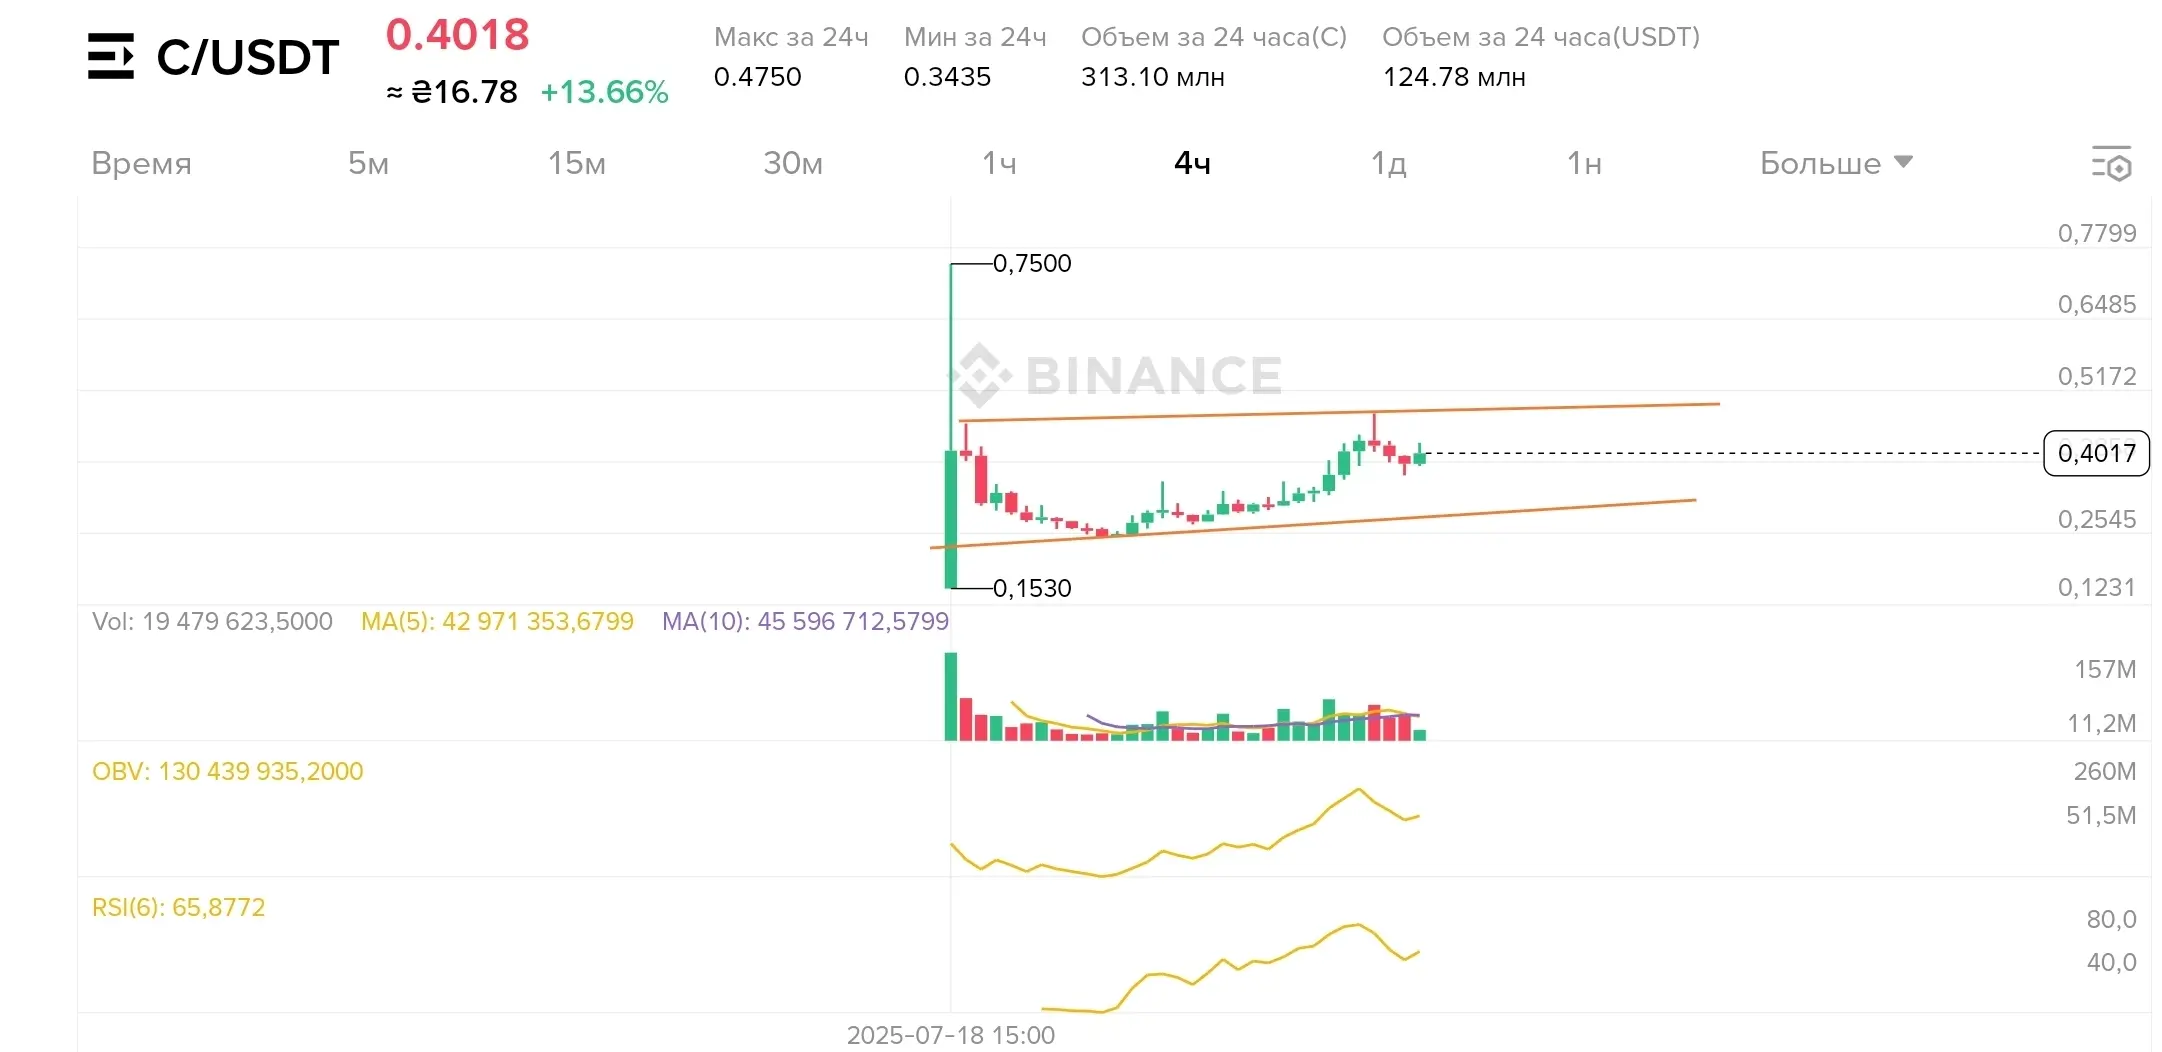
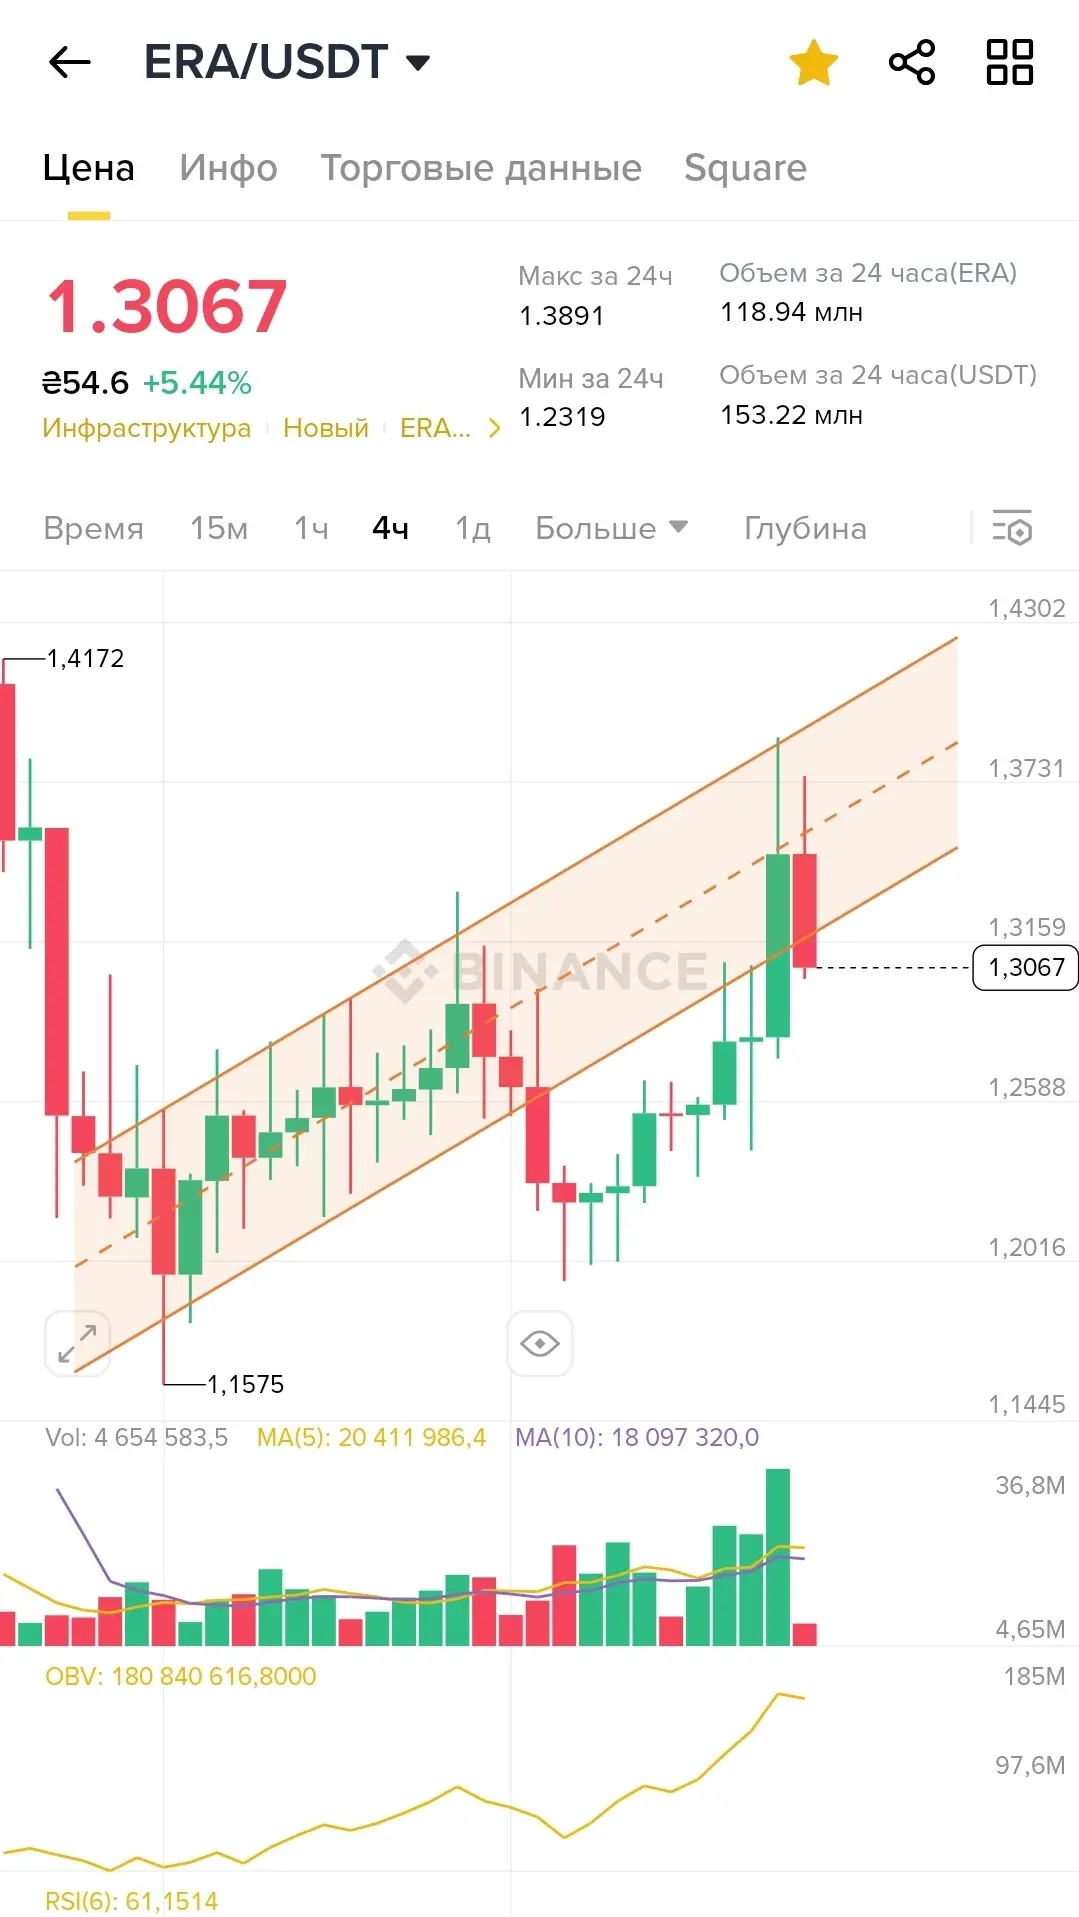
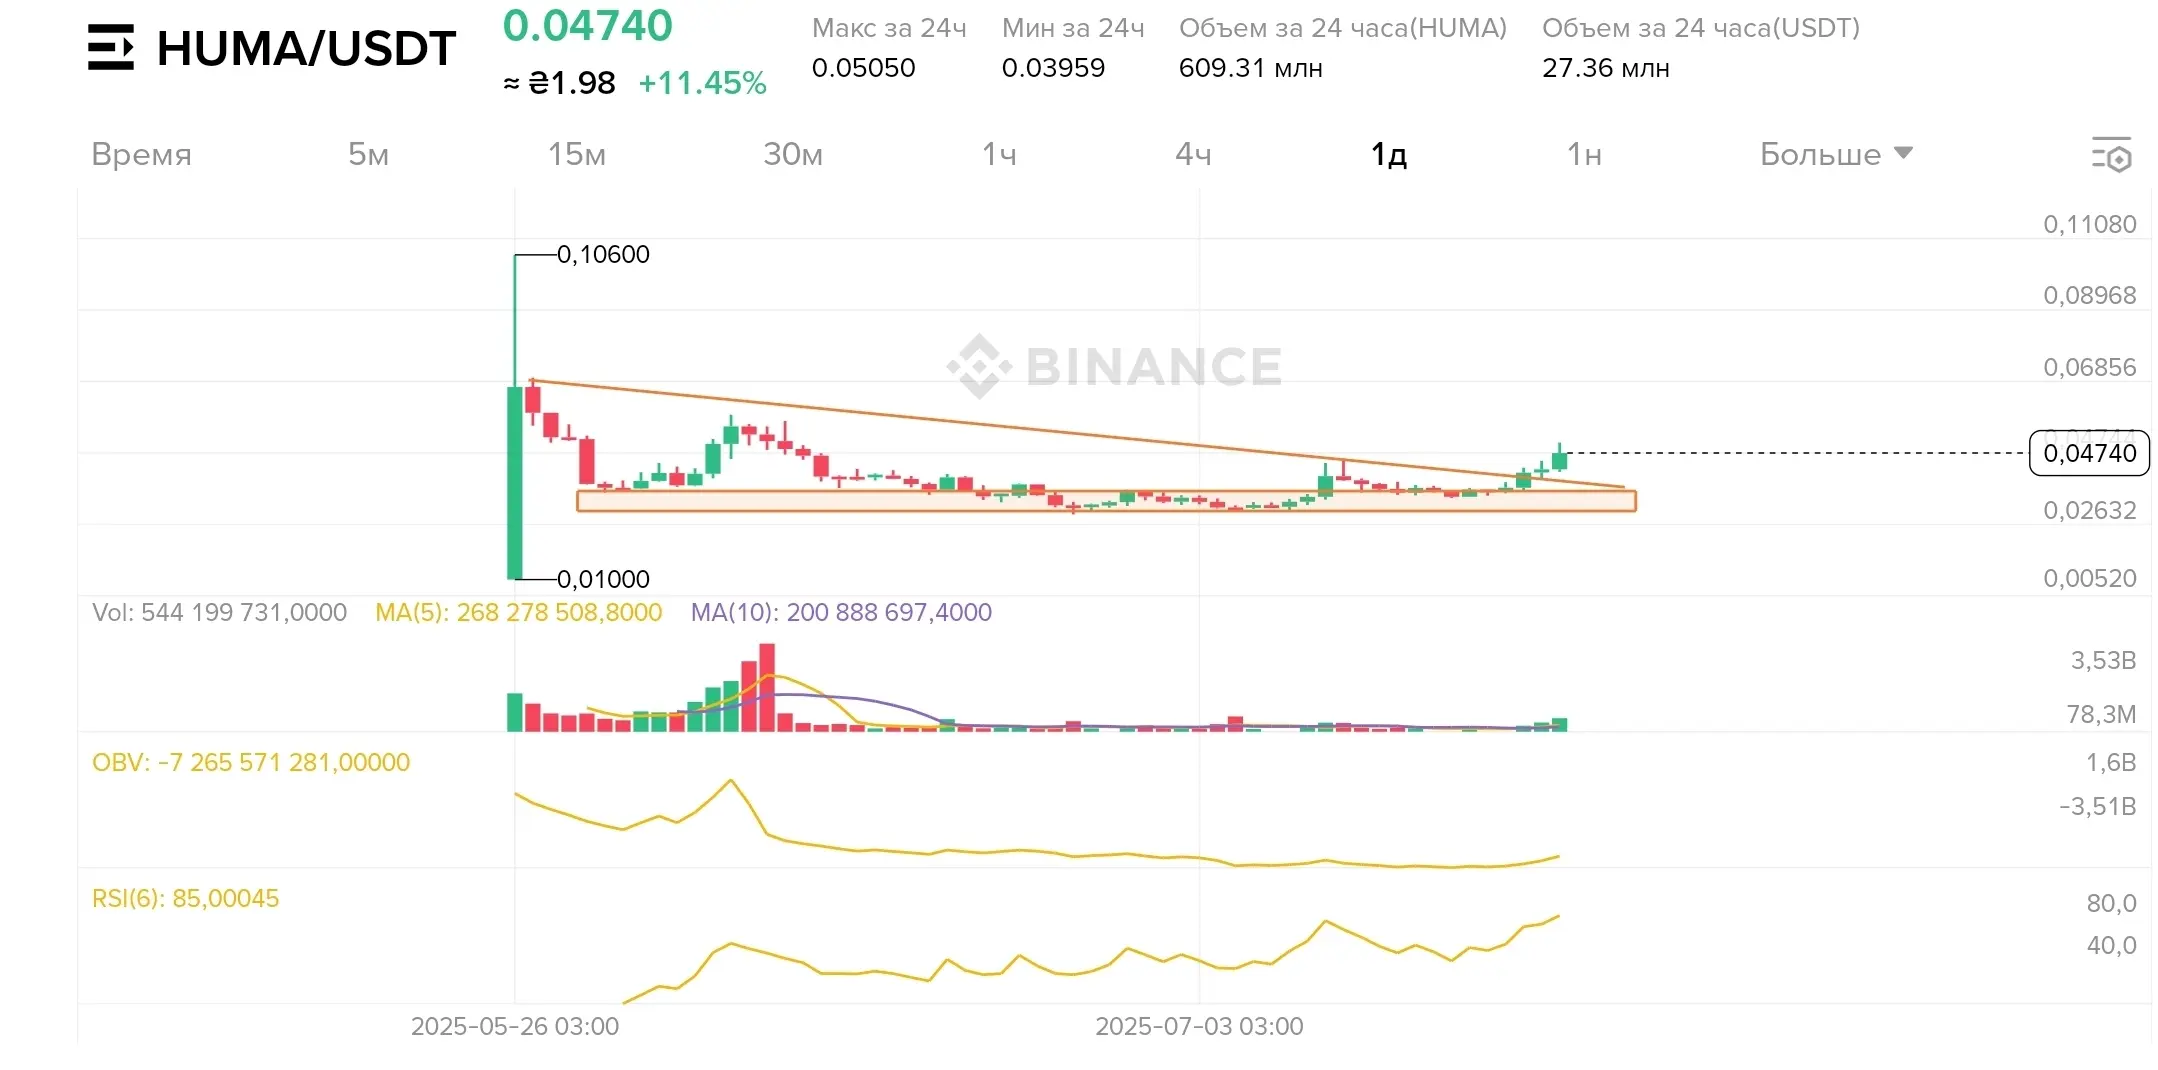
[The user has shared his/her trading data. Go to the App to view more.]