Lixiang
Bitcoin and Ethereum Market Analysis and Operation Guide
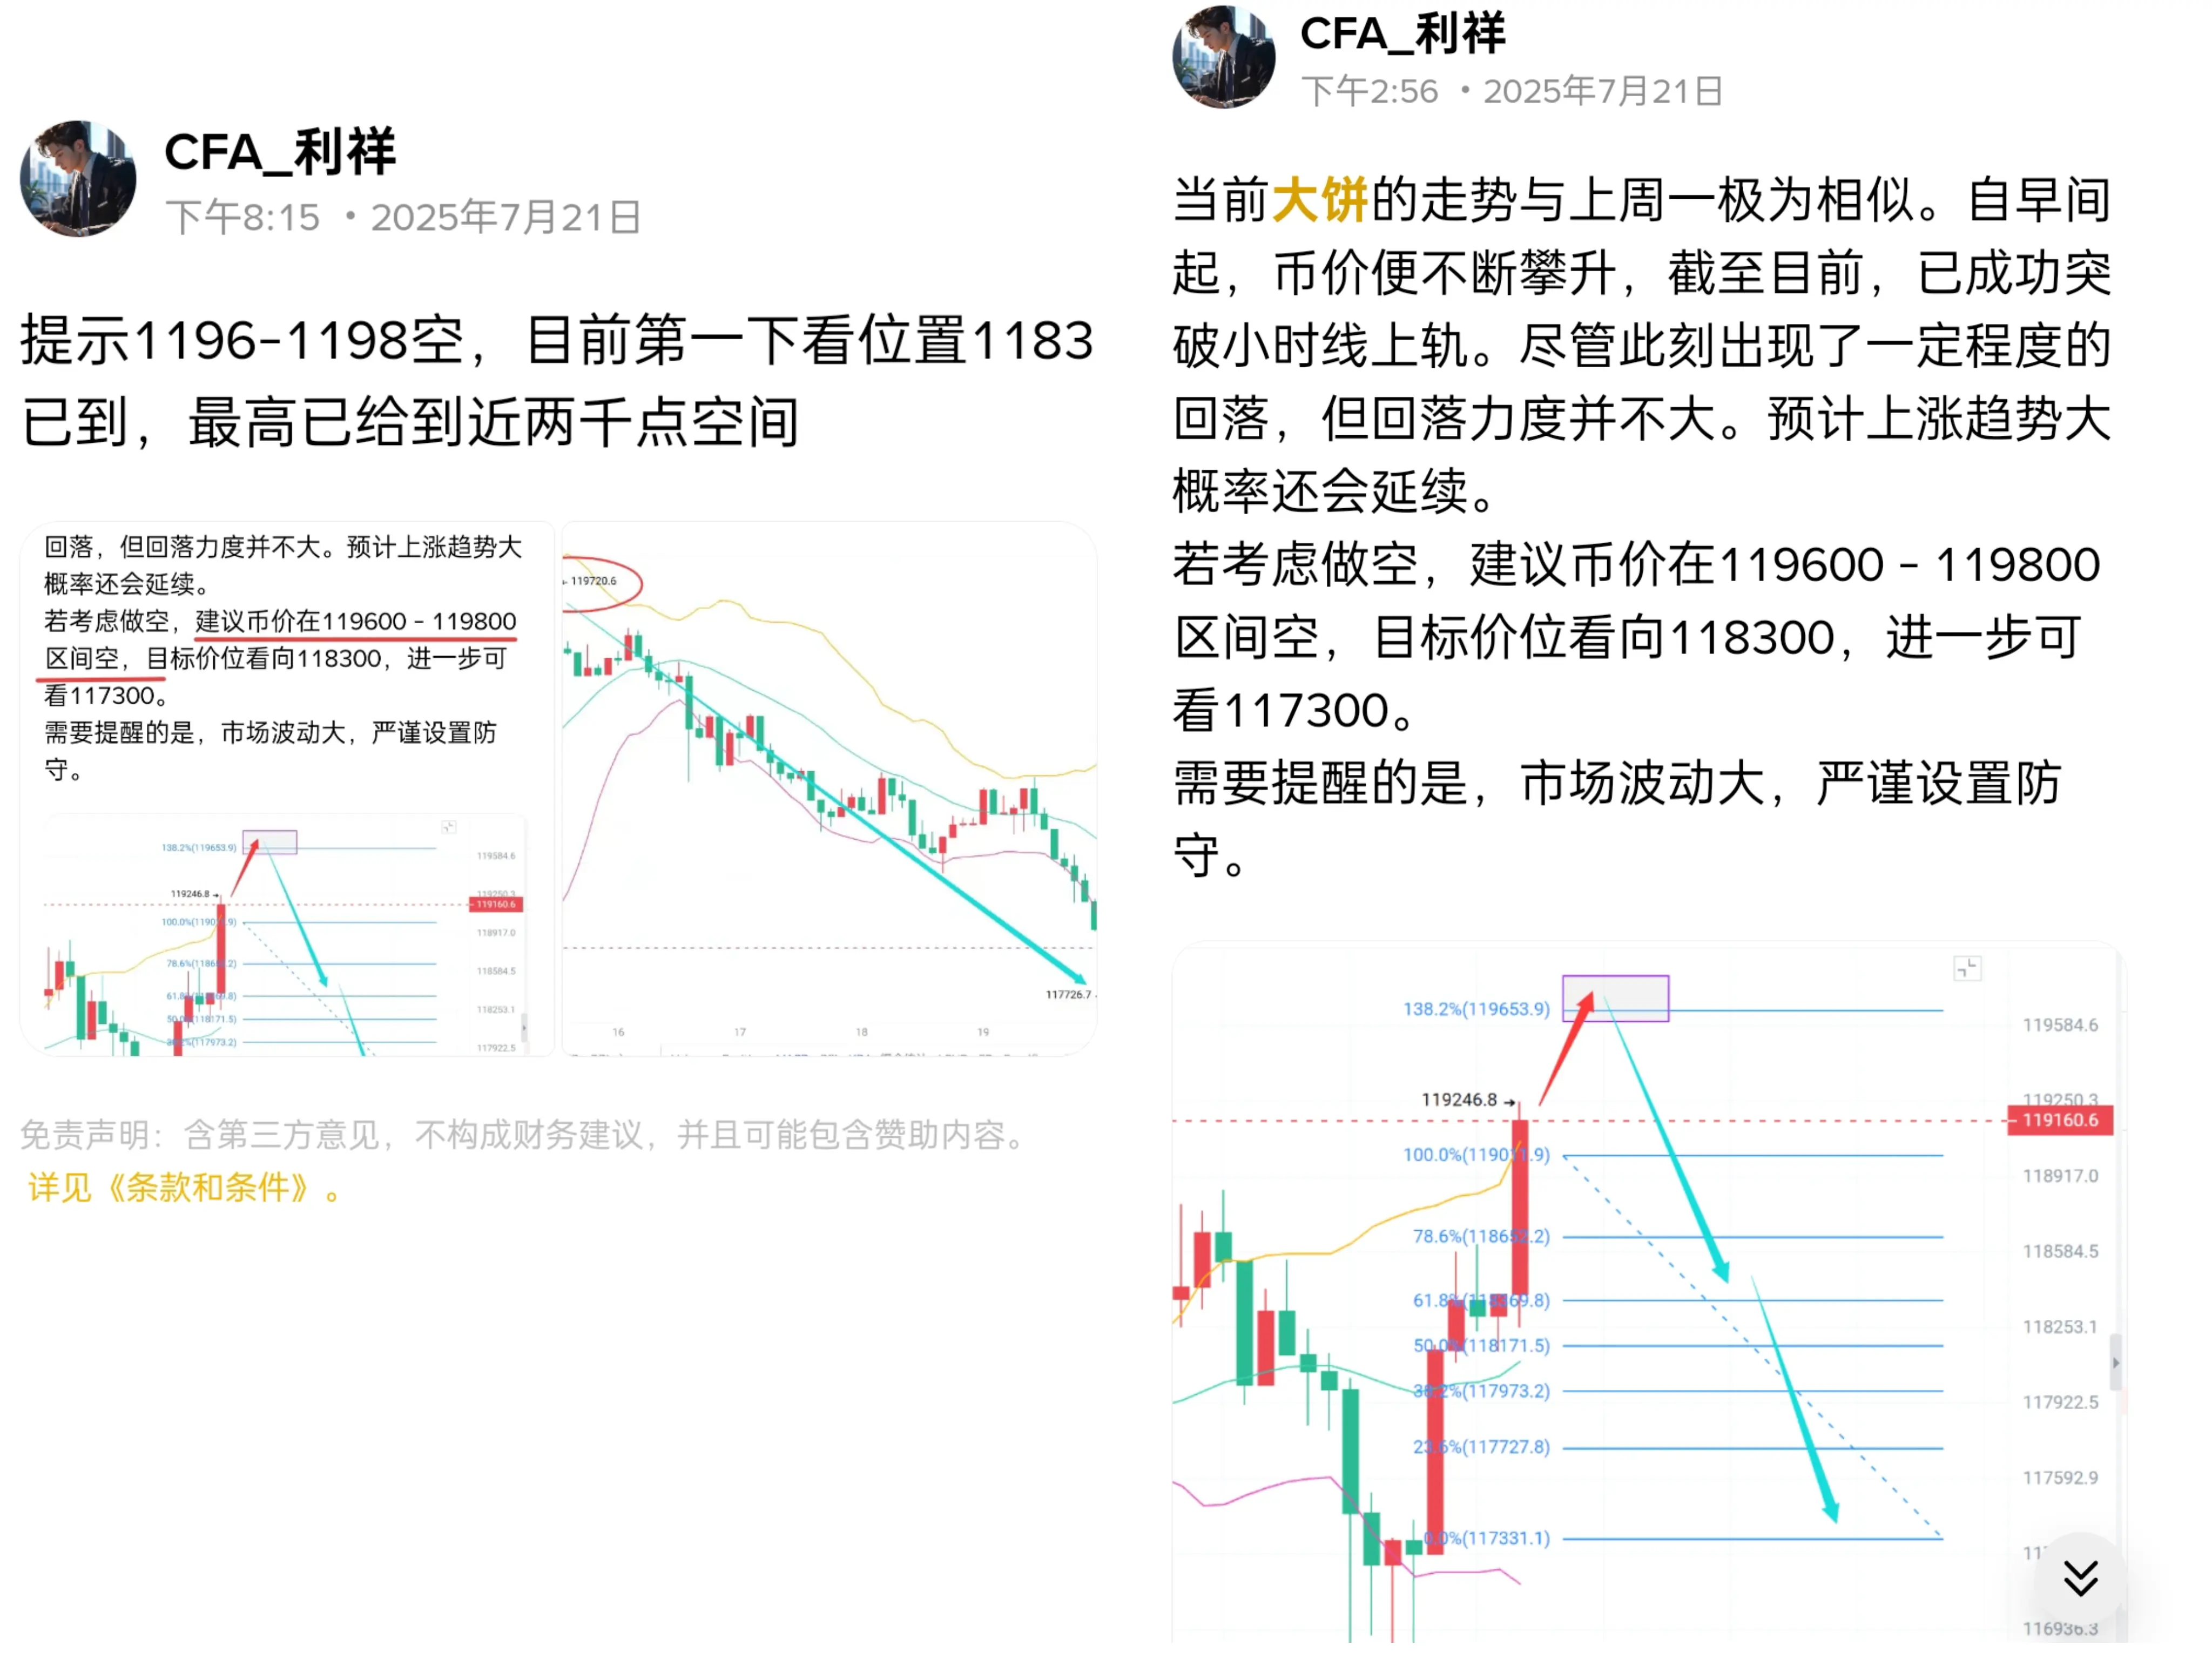
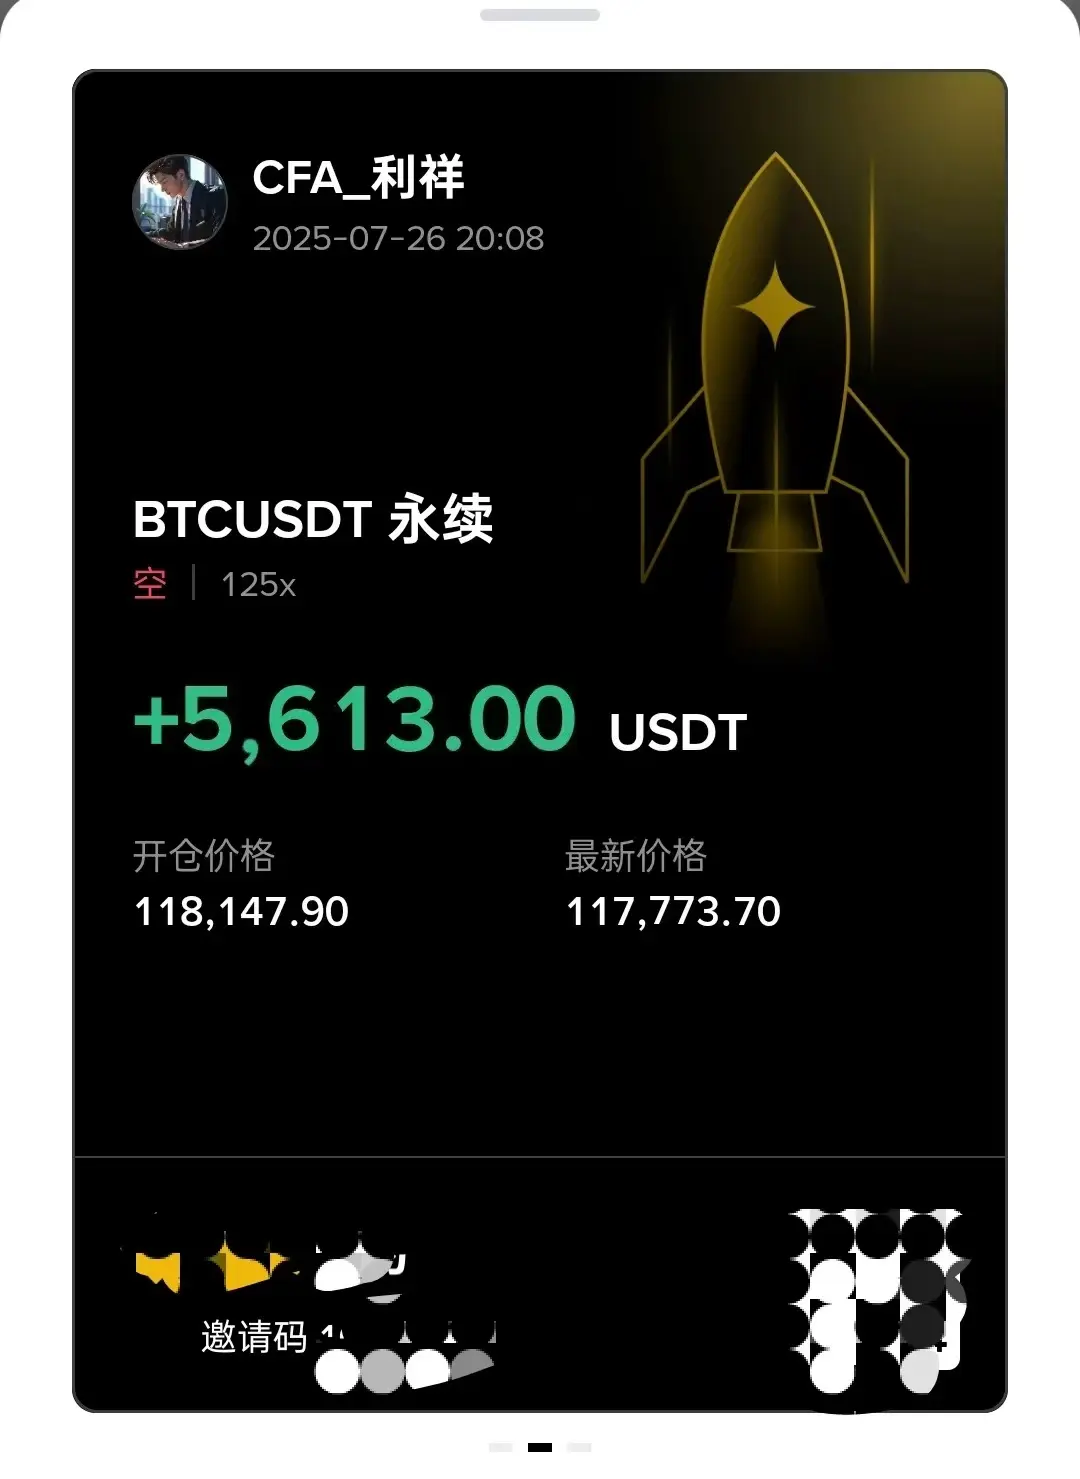
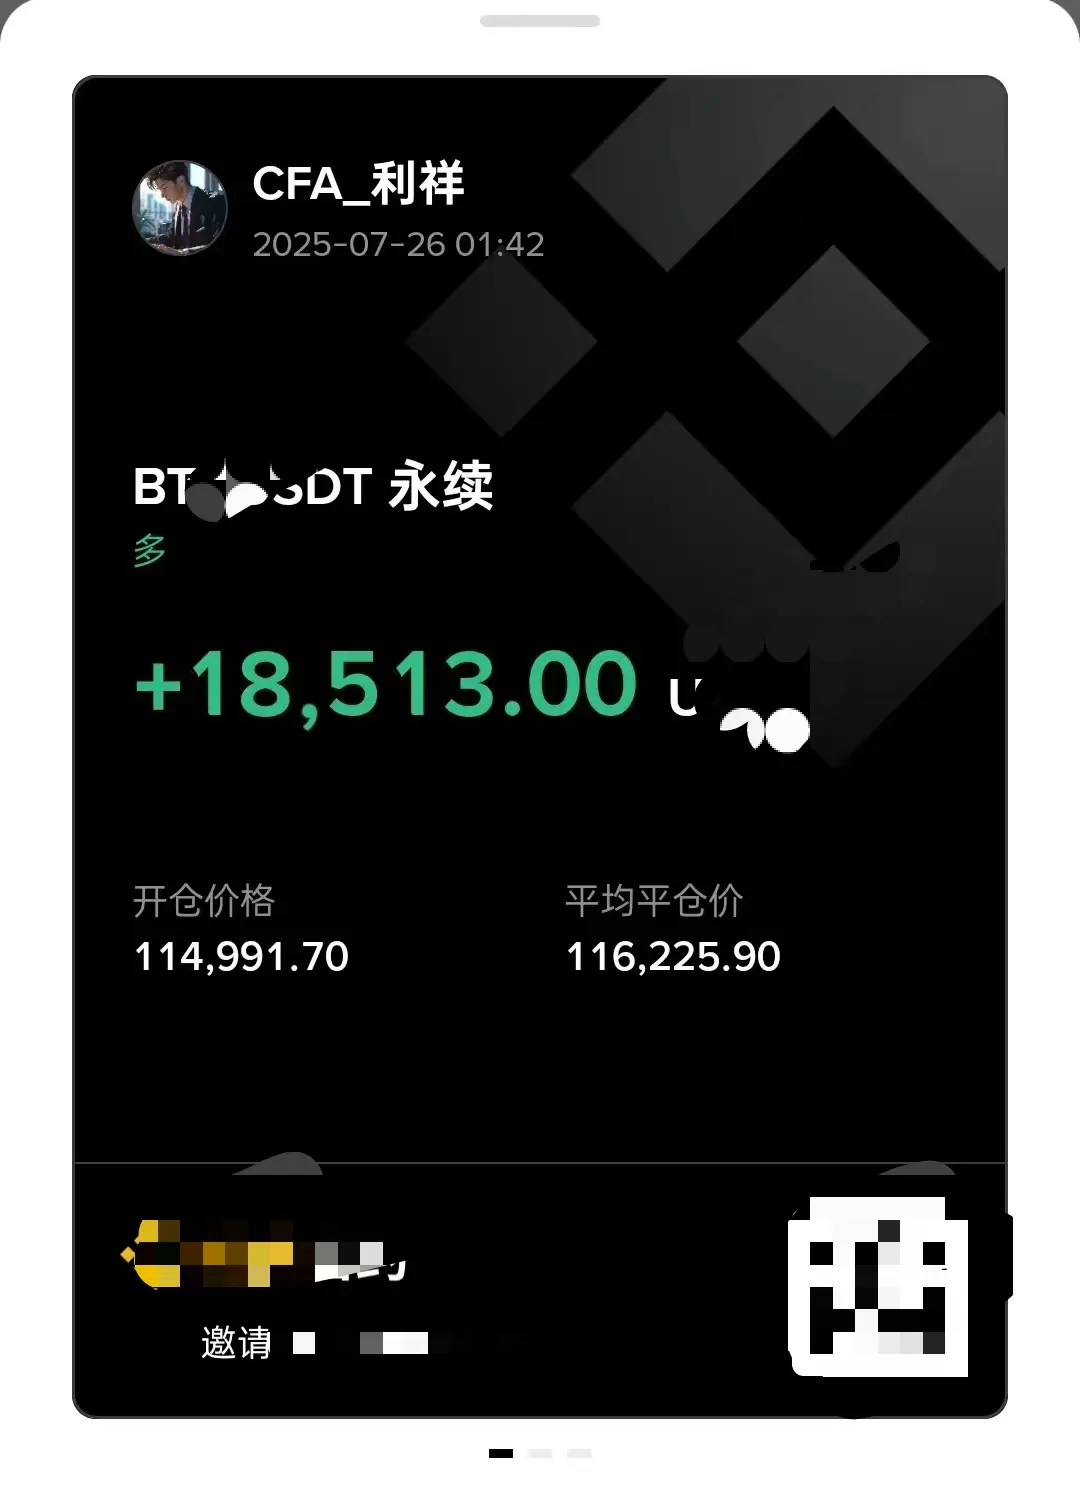
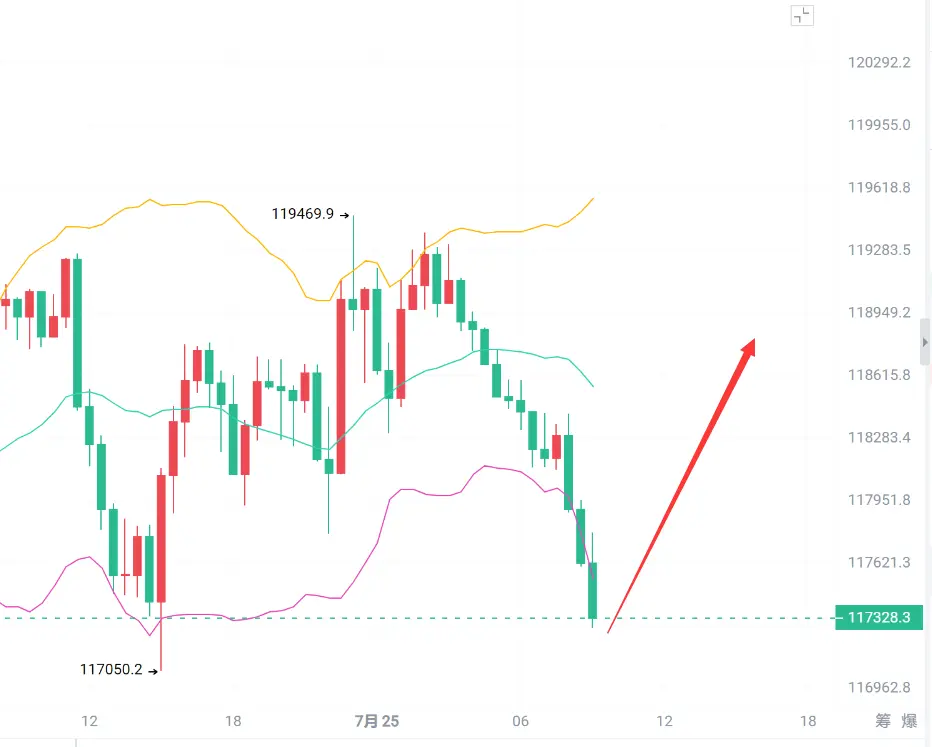
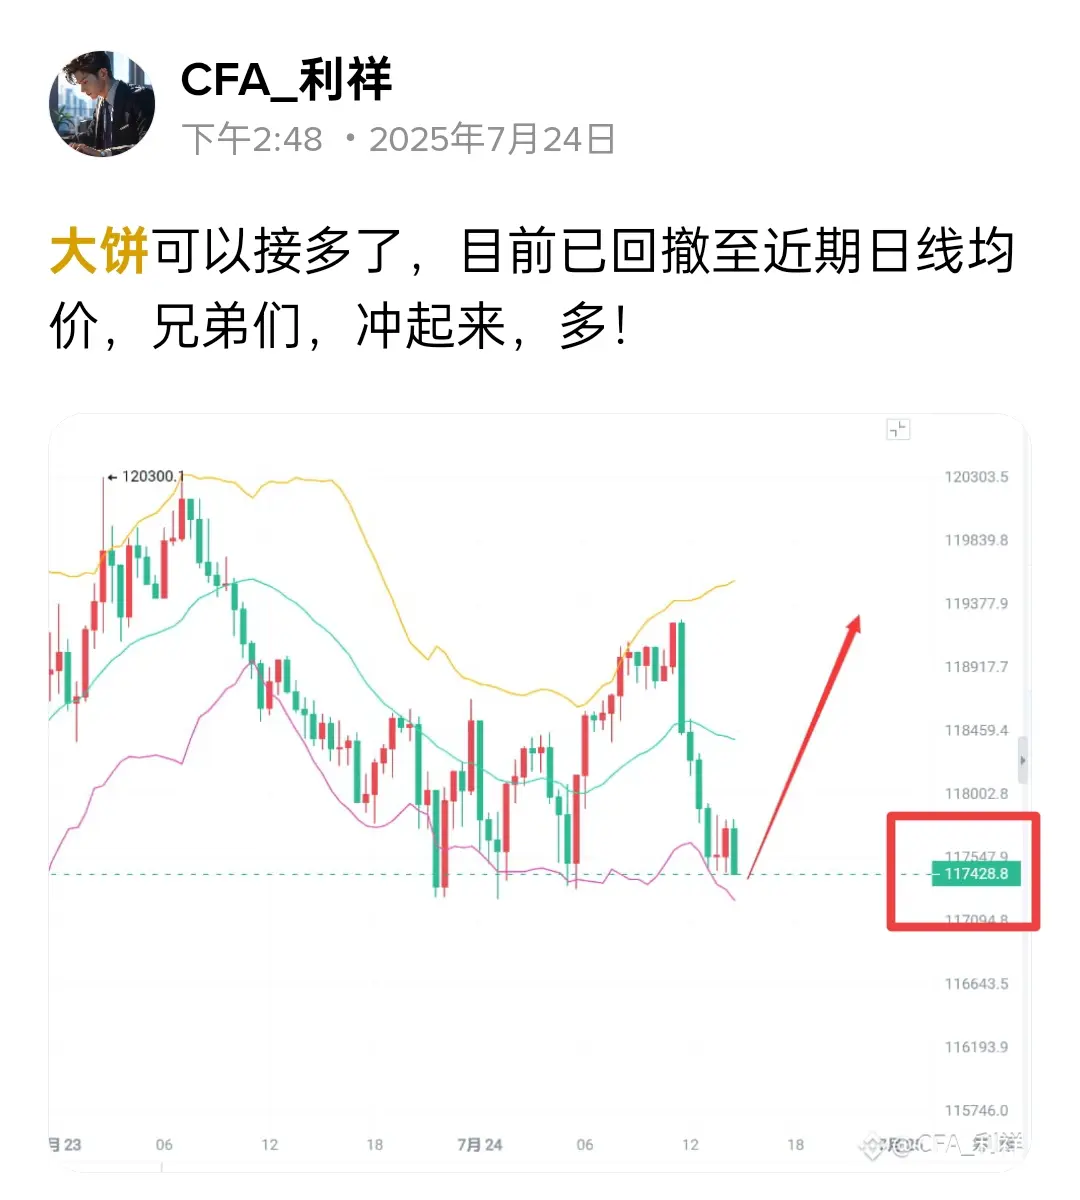
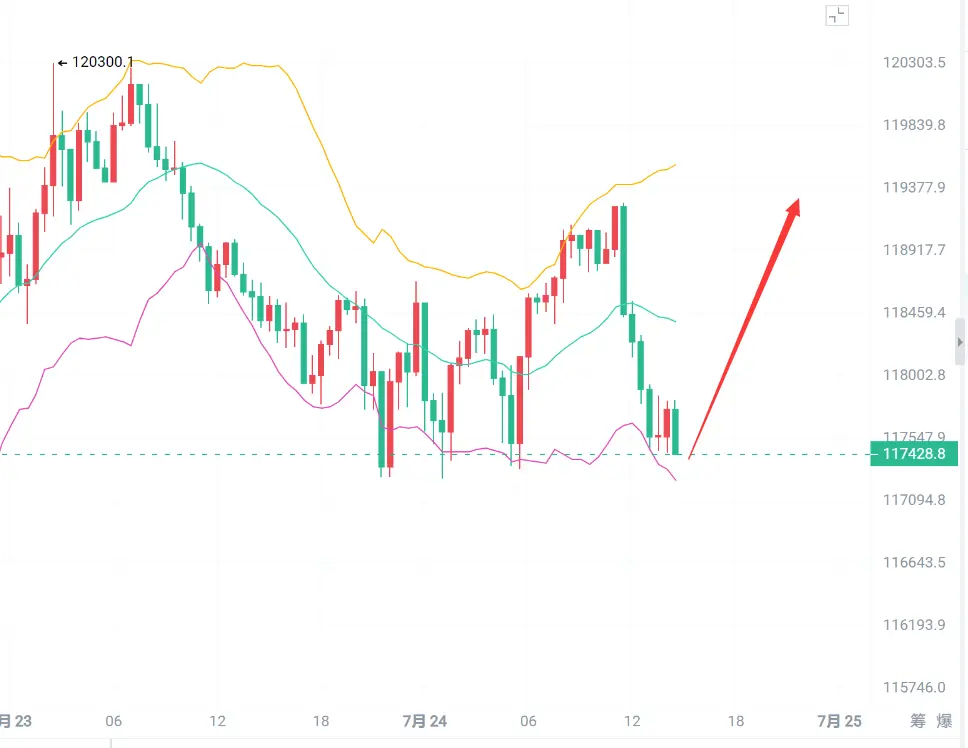
Analyzing from the daily chart perspective, after a rapid rise in Bitcoin recently, it has now entered a phase of sideways consolidation. The Bollinger Bands indicator shows that the upper and lower bands are gradually narrowing, indicating a convergence, which often suggests that the market's volatility is decreasing. Regarding the moving averages, the 5-day, 10-day, and 20-day moving averages are interweaving, showing no clear directional bias. The 5-day moving average fluctuates back and forth between the 10-day and 20-day moving av
View OriginalAnalyzing from the daily chart perspective, after a rapid rise in Bitcoin recently, it has now entered a phase of sideways consolidation. The Bollinger Bands indicator shows that the upper and lower bands are gradually narrowing, indicating a convergence, which often suggests that the market's volatility is decreasing. Regarding the moving averages, the 5-day, 10-day, and 20-day moving averages are interweaving, showing no clear directional bias. The 5-day moving average fluctuates back and forth between the 10-day and 20-day moving av